Lect 18 ML ROC
Keywords
Summary
212 words
Critical Evaluation
Value of the Information & Strength of the Argument
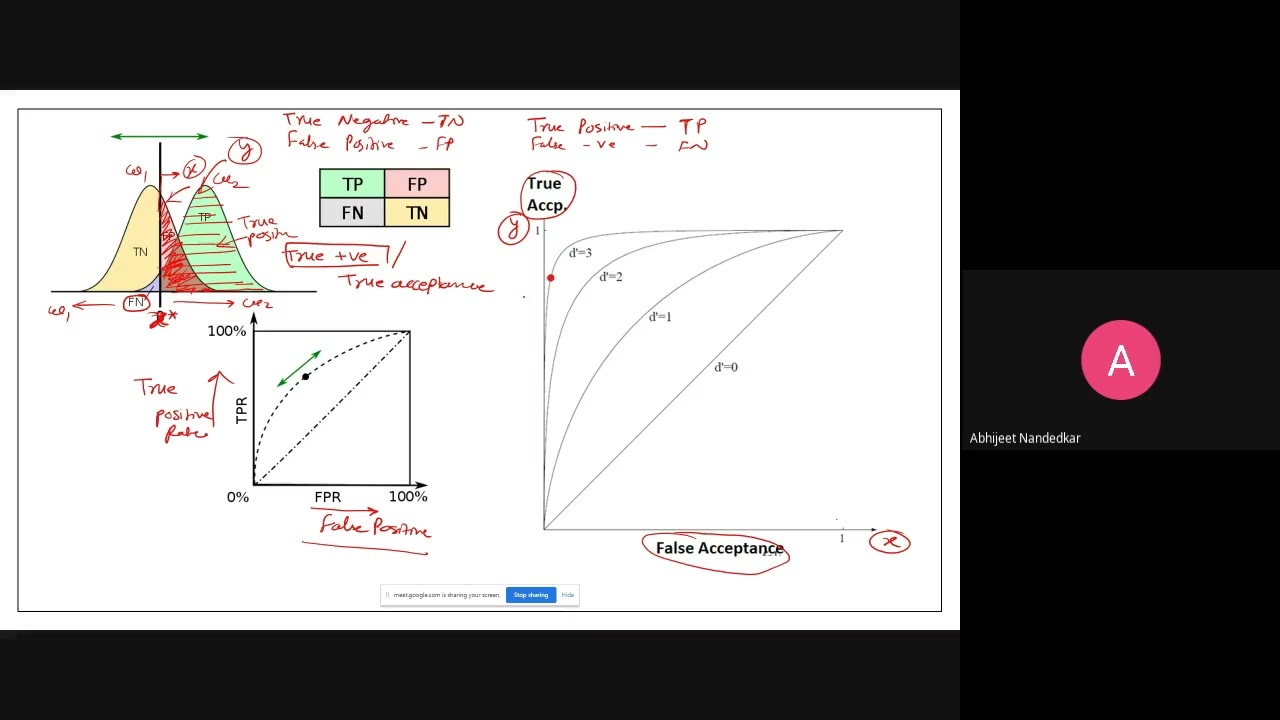
The lecture offers substantial value by clearly explaining the theoretical foundations and practical implications of ROC curves. The argumentation is logical and step-by-step, starting from the historical motivation (radar detection) to the formal definitions and graphical representation. The instructor effectively uses examples of class distributions to demonstrate how threshold choice affects true and false positive rates, and how the ROC curve captures the trade-off. The discussion on the cost of errors (e.g., false alarms leading to missile firing) adds practical relevance. However, the lecture does not delve into quantitative metrics like AUC or provide real-world datasets, which could enhance the argument. The reasoning is sound and well-structured, making the concept accessible to students.
Scientific Rigor, Source Quality, Title Accuracy
The lecture is scientifically rigorous in its treatment of ROC curves, adhering to standard definitions and conventions. The historical note about World War II radar is accurate, though no specific sources are cited. The title ‘Lect 18 ML ROC’ is perfectly aligned with the content, clearly indicating a lecture on ROC curves in machine learning. No external sources or references are provided, which is typical for a classroom lecture but limits the ability to verify claims independently. The absence of citations does not detract from the correctness of the material, as ROC curves are well-established. The lecture maintains a consistent focus on the topic without digressions.
234 words
Title / Content Match
The title 'Lect 18 ML ROC' accurately reflects the content, which is a lecture on ROC curves in machine learning. The title is concise and matches the topic.
Quality & Reliability
7/10
The content is a standard academic lecture on ROC curves, a well-established concept in machine learning and signal detection theory. The explanation is technically accurate, covering key definitions (TP, FP, TN, FN), threshold effects, and the ideal point (0,1). However, no external sources or references are cited, and the lecture relies solely on the instructor's exposition. The historical context (World War II radar) is correct but not attributed to specific sources.
Key Moments
Markers derived by PSI from the transcript: the creator did not define chapters.
- Introduction to ROC curves and their origin in World War II radar systems.
- Explanation of radar signal detection and the problem of false alarms.
- Definition of the four outcomes: true positive, false negative, true negative, false positive.
- Construction of the ROC curve: plotting true positive rate vs. false positive rate.
- Effect of threshold movement on the ROC curve for well-separated classes.
- ROC curve for overlapping classes and the Bayesian decision point.
- Comparison of different classifiers using ROC curves and the ideal point (0,1).
- Practical implications: selecting instruments based on ROC curves and cost considerations.
- Conclusion and preview of Bayesian belief networks.
Contribution & Novelties
This lecture does not present new research but serves as an educational overview of ROC curves, a standard topic in machine learning and signal processing. Its originality lies in the clear, example-driven explanation tailored for students, connecting historical context to modern applications. The emphasis on the cost of errors and the practical selection of instruments adds a valuable perspective often omitted in theoretical treatments.
Pour aller plus loin :
- Receiver operating characteristic — Wikipedia article providing a comprehensive overview of ROC curves, including history, definitions, and applications.
- Signal detection theory — Wikipedia article on the theoretical foundation of ROC analysis in psychology and engineering.
- Bayesian decision theory — Wikipedia article on the Bayesian framework for optimal decision thresholds, referenced at the end of the lecture.
125 words
Radar Profile
The radar profile shows a strong emphasis on information quality and reliability, with moderate scores in quantity and technical depth. This reflects a well-structured lecture that prioritizes clear explanation over exhaustive detail, suitable for an introductory to intermediate audience.