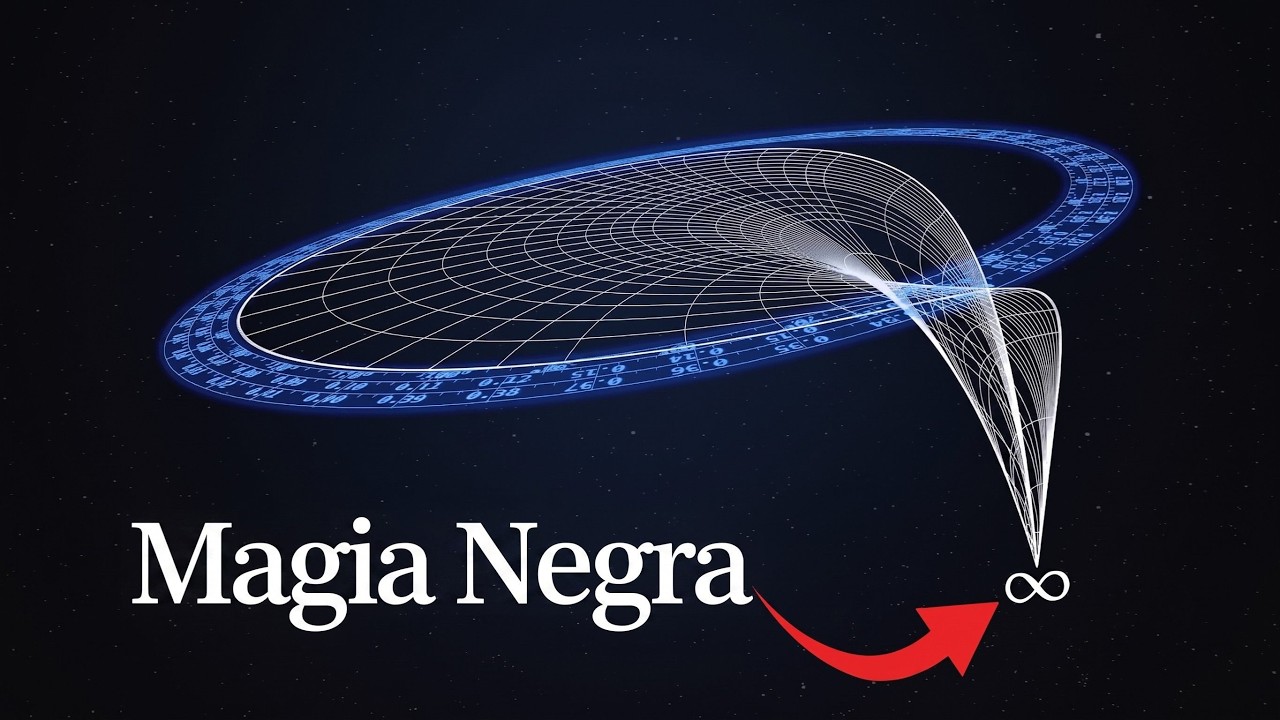
El Gráfico Más Aterrador de la Ingeniería Eléctrica
Keywords
Summary
199 words
Critical Evaluation
Value of the Information & Strength of the Argument
The video provides substantial value by demystifying a complex topic. It builds a logical argument from basic wave physics to the construction of the Smith chart, using clear analogies (springs, complex numbers) and visual demonstrations. The explanation of why impedance matching requires both magnitude and phase alignment is particularly strong, and the historical narrative adds context. The argumentation is solid, with each step building on the previous one, and the use of experiments (e.g., in the anechoic chamber) grounds the theory in practice.
Scientific Rigor, Source Quality, Title Accuracy
The video demonstrates scientific rigor by consulting experts (e.g., Dr. Cynthia Furse, Dr. James Nagel) and providing references (ve42.co/SmithChartsRefs). The demonstrations are carefully set up, and the physics is accurately explained. The title accurately reflects the content, focusing on the Smith chart as an intimidating but essential tool. The video does not overstate claims and clearly distinguishes between theory and practical application.
160 words
Title / Content Match
The title accurately reflects the content: the video focuses on the Smith chart, a notoriously intimidating graphical tool in electrical engineering, and explains its origins, physics, and applications.
Quality & Reliability
8/10
The video is a well-produced educational piece by a reputable science communicator. It explains complex RF engineering concepts with clear demonstrations and analogies, and it cites expert consultations and references. The content is accurate and up-to-date, though it is a popularization and not a peer-reviewed source.
Chapters
Cited Sources
- References for Smith Chart video — List of references cited in the video description.
- Veritasium Patreon — Patreon page for early access to videos.
Concurring Sources
- The scariest thing you learn in Electrical Engineering | The Smith Chart — A video by Zach Star that also discusses the Smith chart, providing a complementary perspective.
Contribution & Novelties
The video offers a fresh perspective on the Smith chart by combining historical narrative, physical demonstrations, and clear visualizations of complex mathematical concepts. It effectively bridges the gap between theoretical impedance matching and practical engineering, making the topic accessible without oversimplifying. The use of conformal mapping to explain the chart’s geometry is particularly illuminating.
Pour aller plus loin :
- Smith chart - Wikipedia — Provides a comprehensive overview of the Smith chart, its construction, and applications.
- Transmission line - Wikipedia — Explains the physics of transmission lines, including characteristic impedance and reflections.
- Impedance matching - Wikipedia — Discusses techniques for maximizing power transfer in electrical systems.
- Conformal map - Wikipedia — Explains the mathematical concept used to create the Smith chart.
121 words
Radar Profile
The radar profile shows high scores in information quantity and quality, with a moderate technical level. This indicates a well-balanced educational video that is both informative and accessible, with a strong emphasis on clear explanation rather than advanced mathematical rigor.